The WPJ
THE WORLD PROPERTY JOURNALReal Estate Facts Not Fiction
Residential Real Estate News

Global Home Price Growth Slows to a 6-Year Low in Q3
Residential News » Monaco Edition | By Michael Gerrity | December 23, 2019 8:30 AM ET
Countries of Hungary, Luxembourg, and Croatia enjoy biggest annual home price jumps
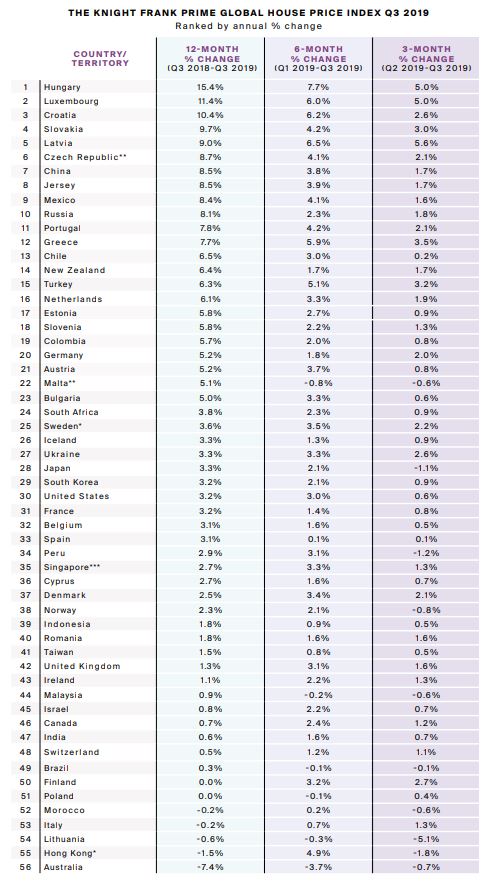
According to global real estate consultant Knight Frank, home prices across 56 countries and territories worldwide are rising at an annual rate of 3.7% on average. This marks the index's slowest rate of growth for over six years. This trend mirrors the pattern observed in Knight Frank's other global city indices - across both the mainstream and prime segments.
Analysis of the latest available data, shows Hungary leads the index this quarter with 15.4% annual price growth, boosted by a robust economy (4.9% GDP growth forecast in 2019*), low mortgage rates, high wage growth and a range of government subsidy measures.
However, other previous frontrunners from the last two years have cooled significantly - Slovenia (18th), Malta (22nd) and Iceland (26th) either due to weaker economic landscapes, affordability concerns or a decline in tourism.
In contrast, some countries and territories are rising up the rankings. A year ago, Greece sat in 24th place with price growth of 2.4%. Although prices still sit 37% below their 2008 peak, they are now rising at a rate of 7.7% per annum and Greece is ranked 12th out of 56 countries and territories.
Seven of the top ten rankings this quarter are European countries and most are located within Central and Eastern Europe. Here, prices are rising from a low base, economies are strengthening and borrowing costs are close to record lows.
On a world region basis, Russia & the CIS lead the rankings, registering average annual growth of 5.7% - prices in Russia are up 8.1% over the 12-month period and Ukraine has moved off the bottom rank in the last year and is now averaging 3.3% growth per annum.
Knight Frank publishes two indices tracking mainstream prices, its Global Residential Cities Index (150 cities) and their Global House Price Index (country level). A comparison of the two indices highlights two key trends. Firstly, the extent to which national house prices lag city markets by approximately six months and secondly, the degree to which the performance gap between the two has narrowed since 2018.
Sign Up Free | The WPJ Weekly Newsletter
Relevant real estate news.
Actionable market intelligence.
Right to your inbox every week.
Real Estate Listings Showcase
Related News Stories
Residential Real Estate Headlines
- Las Vegas Area Home Prices Uptick 4.3 Percent Annually in March
- Single-Family Rent Growth in U.S. Trends Upward in 2025
- U.S. Mortgage Rates Tick Down Post Trump Tariffs Commencement
- President Trump's 'Liberation Day' Tariffs Potential Impact on the U.S. Housing and Mortgage Markets
- Baby Boomers Biggest Cohort of U.S. Home Buyers in 2025 as Millennials Decline
- U.S. Monthly Housing Payments Hit Record High in 2025
- U.S. Pending Home Sales Uptick in February
- Global Prime Residential Rent Slowdown Continued in Late 2024
- Ireland Home Price Inflation Hits 8 Year High in Early 2025
- Existing Home Sales in America Uptick in February
- Great Miami Area Residential Sales Decline 15 Percent Annually in February
- Mortgage Rates Uptick in Mid-March, Ending 9-Week Decline in U.S.
- World Property Ventures Builds the Future of Real Estate with New Funding Round
- U.S. Builder Sentiment Declines Amid Economic Uncertainty and Rising Costs
- Black Homeownership Rates in U.S. Enjoy Largest Annual Increase of All Racial Groups
- Wealthy Renters Are Taking Over More of the U.S. Rental Market
- If U.S. Congress Does Not Extend NFIP Soon, Thousands of Daily Home Closings Impacted
- U.S. Mortgage Applications Spike 11 Percent in Early March
- Greater Palm Beach Area Residential Sales Rise in Early 2025
- New Apartments in U.S. Are Leasing at Slowest Pace on Record
- U.S. Mortgage Rates Drop to 4 Month Low in March
- Overall U.S. Mortgage Delinquency Rates Dip in December
- New Tariffs on Canada, Mexico to Impact U.S. Homebuilder Input Costs
- Monaco's Property Market: A Tale of Two Cities
- U.S. Home Purchase Cancellations Surge, 1 in 7 Sales Getting Canceled
- U.S. Pending Home Sales Hit Historic Low in Early 2025
- Greater Miami Area Residential Sales Dip in January
- Governor DeSantis Supports Ending Property Taxes in Florida
- WPV Aims to Become the Berkshire Hathaway of Real Estate Tech
- U.S. Home Sales Slump Continues in January
- Average Americans Spend 38 Percent of Monthly Income on Mortgage Payments
- Switzerland's Safe-Haven Appeal Grows with World's Wealthy Homebuyers
- U.S. Builder Confidence Rapidly Declines in February
- Las Vegas Home Sales Rise 6.7 Percent Annually in January, Condo Sales Dip
- Homebuyer Demand in America Drops to 5-Year Low in Early 2025
- Ownership More Affordable Than Renting in Most U.S. Markets
- The World's First Global Listings Service Launches, Called a GLS
- Home Prices Continue to Rise in 89 Percent of U.S. Metros in Late 2024
- Global Luxury Residential Prices Showed Gradual Improvement in Late 2024
- U.S. Construction Hiring Rate Drops to Lowest Levels in 5 Years
Reader Poll
Marketplace Links
This website uses cookies to improve user experience. By using our website you consent in accordance with our Cookie Policy. Read More


