Commercial Real Estate News

Multifamily Property Sector in America Rebounding
Investment in Multifamily Increases 59 Percent Annually in Q4
CBRE's latest research highlights a strong recovery in the U.S. multifamily market during late 2024, fueled by declining vacancy rates and robust demand.
Net absorption--a key measure of occupied unit changes--reached 183,600 units in Q4 2024, marking the strongest fourth-quarter performance on record and 12 times higher than the pre-pandemic average. This was the third consecutive quarter where demand outpaced new completions, narrowing the annual supply-demand gap.
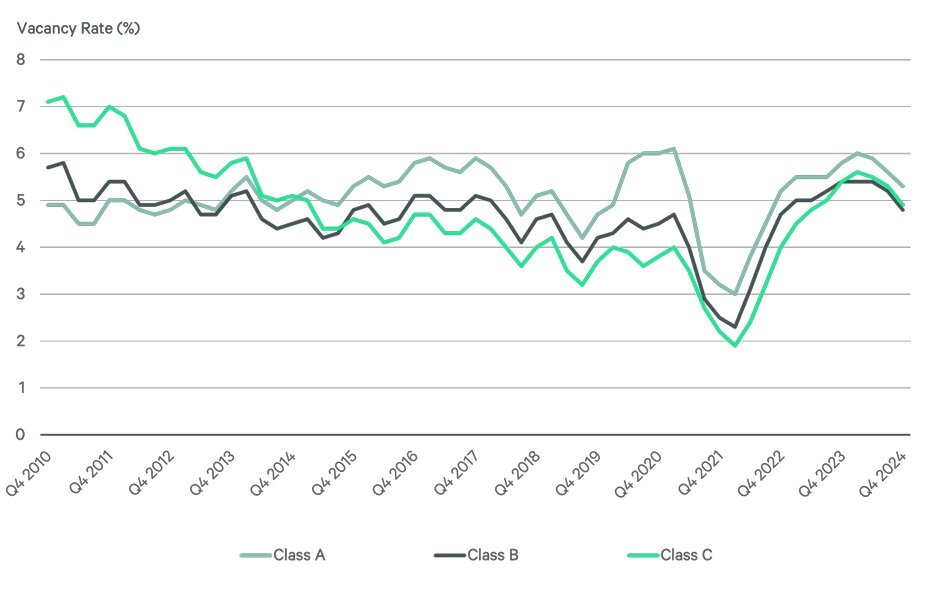
In Q4 2024, healthy renter demand exceeded new deliveries, reducing the overall multifamily vacancy rate to 4.9%, slightly below the long-term average of 5.0%.
Monthly rents rose by 0.5% year-over-year, reaching an average of $2,176. With construction completions slowing and strong demand continuing, rent growth is expected to accelerate in the months ahead.
Although a record 450,000 units were delivered in 2024, the pace of new construction starts has eased, which should help stabilize supply and demand over time.
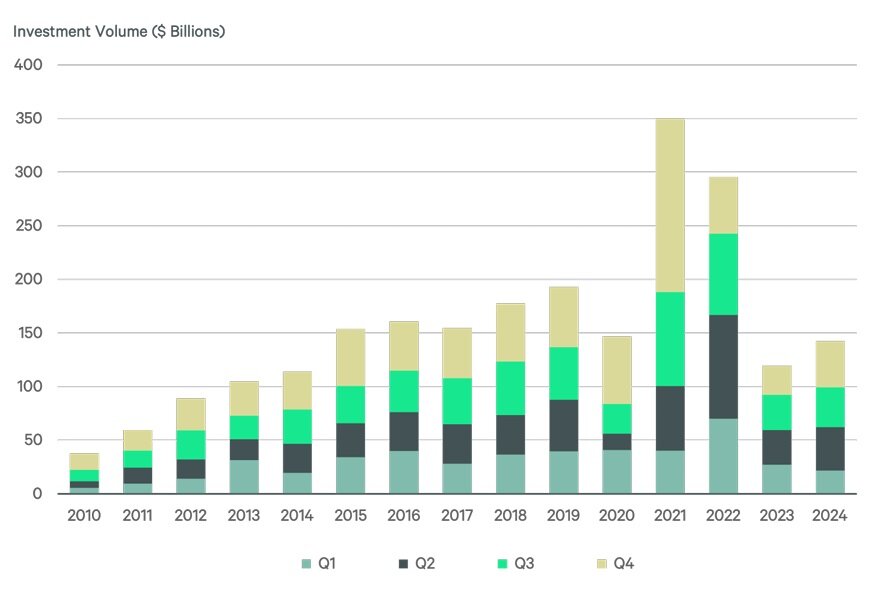
Investor confidence in the sector remains strong, with investment activity surging by 59% year-over-year in Q4 2024, totaling $43.4 billion in capital deployment.
"The strong performance of the multifamily market reflects significant demand for housing and signals the continued strengthening of fundamentals," said Kelli Carhart, leader of Multifamily Capital Markets for CBRE. "We expect to see more positive gains throughout 2025 and then accelerate in 2026, fueling increased multifamily investment activity."
Other Q4 2024 Multifamily Sector Highlights:
- The Midwest (2.8%), Northeast (2.3%), and Pacific (0.4%) regions experienced solid year-over-year rent growth. Rents fell in the Southeast, South Central and Mountain regions.
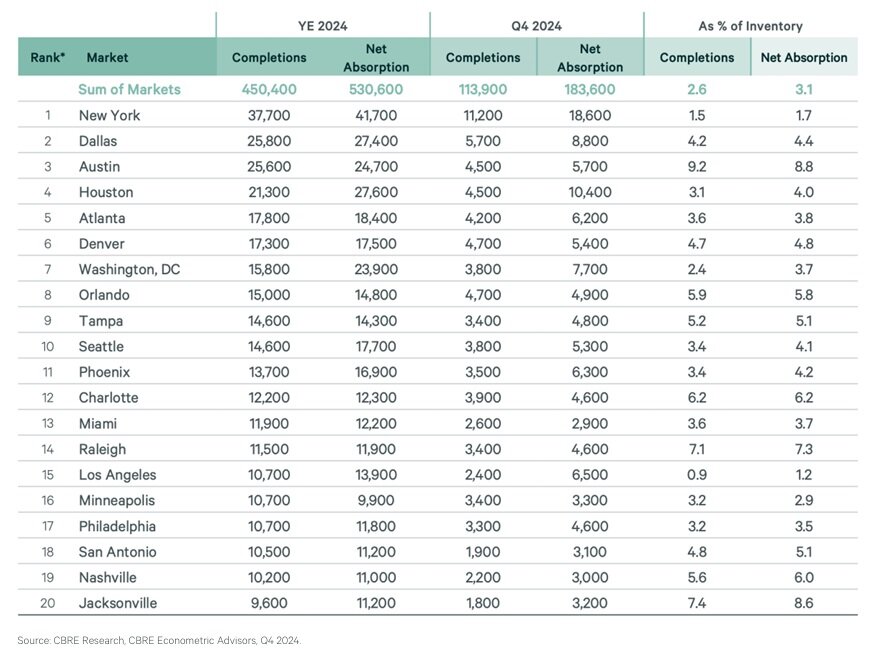
- All 69 markets tracked by CBRE recorded positive net absorption in Q4 2024, with New York (18,600 units), Houston (10,400) and Dallas (8,800) leading the way.
- Sixty-four markets saw net absorption exceed new supply in Q4 2024, up from 50 markets in Q3 2024 and 45 in Q2 2024.
- Vacancy rates declined in 63 markets quarter-over-quarter in Q4 2024, up from 56 markets in Q3 2024.