Residential Real Estate News

U.S. Residential Foreclosures Dip 10 Percent Annually in 2024
Residential News » Irvine Edition | By Michael Gerrity | January 16, 2025 8:34 AM ET
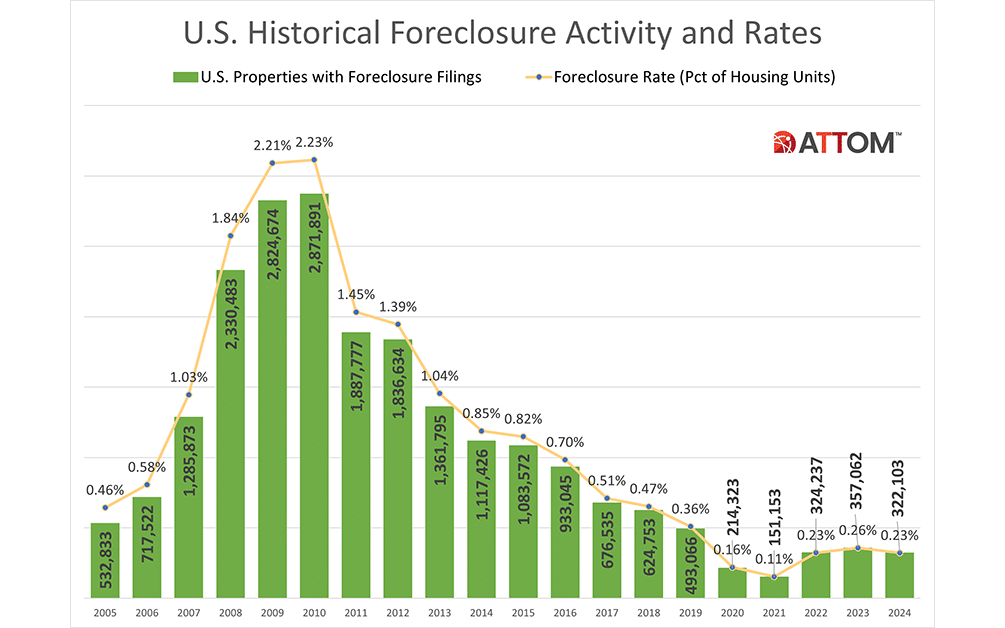
According to ATTOM's Year-End 2024 U.S. Foreclosure Market Report, foreclosure filings--comprising default notices, scheduled auctions, and bank repossessions--were reported on 322,103 U.S. properties in 2024. This marks a 10 percent decline from 2023, a 1 percent drop from 2022, and a 35 percent decrease from 2019, prior to the pandemic's impact on the market. Foreclosure filings in 2024 also represented a sharp 89 percent decrease from the 2.9 million peaks in 2010.
These 322,103 properties accounted for 0.23 percent of all U.S. housing units, down slightly from 0.25 percent in 2023 and significantly lower than 0.36 percent in 2019, with a peak of 2.23 percent in 2010. Rob Barber, CEO of ATTOM, commented, "The continued decline in foreclosure activity throughout 2024 suggests a housing market that may be stabilizing, even as economic uncertainties persist. This year's data points to foreclosure trends potentially returning to more predictable levels, offering greater clarity for industry professionals, investors, and homeowners. While foreclosure filings remain an important indicator of market health, current trends suggest a more balanced landscape, potentially influenced by careful lending practices and homeowner resilience."
December 2024 data showed 28,632 U.S. properties with foreclosure filings, marking a 3 percent decrease from the previous month and a 6 percent decline compared to the same month in 2023.
Decline in Foreclosure Starts Nationwide
Lenders initiated foreclosure proceedings on 253,306 U.S. properties in 2024, down 6 percent from 2023 but up 174 percent from 2021. This was still 25 percent lower than 2019 and 88 percent less than the 2009 peak of 2,139,005 starts.
The states with the highest number of foreclosure starts in 2024 were California (29,529), Florida (29,239), Texas (28,946), New York (14,436), and Illinois (13,082).
Among metropolitan statistical areas with populations exceeding 1 million, the largest number of foreclosure starts were reported in New York (15,327), Chicago (11,508), Houston (10,197), Los Angeles (8,790), and Miami (8,603).
Continued Decline in Bank Repossessions
Lenders repossessed 36,505 properties in 2024, a 13 percent decrease from 2023, and a 75 percent drop from 2019 (143,955), as well as a staggering 97 percent decrease from the 2010 peak of 1,050,500 REOs.
The states with the highest number of REOs in 2024 were California (3,466), Illinois (2,858), Pennsylvania (2,828), Michigan (2,629), and Texas (2,501).
The metro areas with the greatest number of REOs included Chicago (1,976), New York (1,815), Detroit (1,575), Philadelphia (946), and Baltimore (905).
States with Highest Foreclosure Rates
The states with the highest foreclosure rates in 2024 were Florida (1 in every 267 housing units), New Jersey (1 in every 267), Nevada (1 in every 273), Illinois (1 in every 278), and South Carolina (1 in every 304).
The top 10 states included Connecticut, Maryland, Ohio, Indiana, and Delaware, with foreclosure rates ranging from 1 in every 306 to 1 in every 329 housing units.
Highest Metro Foreclosure Rates
Among the 224 metros with populations over 200,000, the highest foreclosure rates in 2024 were in Lakeland, FL (1 in every 172 housing units), Atlantic City, NJ (1 in every 200), Columbia, SC (1 in every 204), Cleveland, OH (1 in every 208), and Las Vegas, NV (1 in every 231).
Among larger metro areas, Orlando, FL (1 in every 234), Jacksonville, FL (1 in every 241), Chicago, IL (1 in every 245), and Miami, FL (1 in every 247) also had high foreclosure rates.
Foreclosure Timelines
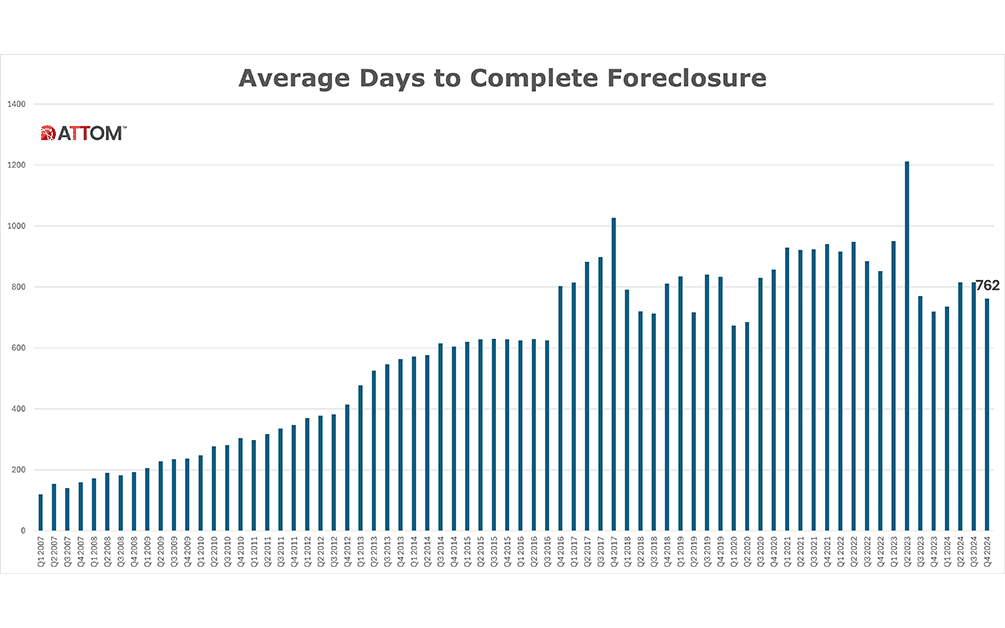
U.S. properties foreclosed in the fourth quarter of 2024 had been in the foreclosure process for an average of 762 days, a 6 percent decrease from the previous quarter but a 6 percent increase from the previous year.
The states with the longest average foreclosure timelines in Q4 2024 were Louisiana (3,015 days), Hawaii (2,505 days), New York (2,099 days), Wisconsin (1,989 days), and Nevada (1,750 days).
Key Takeaways: Q4 2024 Foreclosure Activity
- A total of 84,361 properties had foreclosure filings in Q4 2024, down 3 percent from the previous quarter and 9 percent from the same period in 2023.
- One in every 1,671 properties nationwide had a foreclosure filing during Q4 2024.
- States with the highest foreclosure rates in Q4 2024 were Nevada, Florida, New Jersey, Indiana, and Connecticut.
Key Takeaways: December 2024 Foreclosure Activity
- One in every 4,922 properties nationwide had a foreclosure filing in December 2024.
- States with the highest foreclosure rates in December were Nevada, Indiana, Maryland, Utah, and New Jersey.
- Foreclosure starts in December 2024 totaled 19,376, down 4 percent from the prior month and 5 percent from a year ago.
- Lenders completed foreclosures on 2,957 properties in December 2024, down 4 percent from the previous month and 16 percent from a year ago.
Sign Up Free | The WPJ Weekly Newsletter
Relevant real estate news.
Actionable market intelligence.
Right to your inbox every week.
Real Estate Listings Showcase
Related News Stories
Residential Real Estate Headlines
- Las Vegas Area Home Prices Uptick 4.3 Percent Annually in March
- Single-Family Rent Growth in U.S. Trends Upward in 2025
- U.S. Mortgage Rates Tick Down Post Trump Tariffs Commencement
- President Trump's 'Liberation Day' Tariffs Potential Impact on the U.S. Housing and Mortgage Markets
- Baby Boomers Biggest Cohort of U.S. Home Buyers in 2025 as Millennials Decline
- U.S. Monthly Housing Payments Hit Record High in 2025
- U.S. Pending Home Sales Uptick in February
- Global Prime Residential Rent Slowdown Continued in Late 2024
- Ireland Home Price Inflation Hits 8 Year High in Early 2025
- Existing Home Sales in America Uptick in February
- Great Miami Area Residential Sales Decline 15 Percent Annually in February
- Mortgage Rates Uptick in Mid-March, Ending 9-Week Decline in U.S.
- World Property Ventures Builds the Future of Real Estate with New Funding Round
- U.S. Builder Sentiment Declines Amid Economic Uncertainty and Rising Costs
- Black Homeownership Rates in U.S. Enjoy Largest Annual Increase of All Racial Groups
- Wealthy Renters Are Taking Over More of the U.S. Rental Market
- If U.S. Congress Does Not Extend NFIP Soon, Thousands of Daily Home Closings Impacted
- U.S. Mortgage Applications Spike 11 Percent in Early March
- Greater Palm Beach Area Residential Sales Rise in Early 2025
- New Apartments in U.S. Are Leasing at Slowest Pace on Record
- U.S. Mortgage Rates Drop to 4 Month Low in March
- Overall U.S. Mortgage Delinquency Rates Dip in December
- New Tariffs on Canada, Mexico to Impact U.S. Homebuilder Input Costs
- Monaco's Property Market: A Tale of Two Cities
- U.S. Home Purchase Cancellations Surge, 1 in 7 Sales Getting Canceled
- U.S. Pending Home Sales Hit Historic Low in Early 2025
- Greater Miami Area Residential Sales Dip in January
- Governor DeSantis Supports Ending Property Taxes in Florida
- WPV Aims to Become the Berkshire Hathaway of Real Estate Tech
- U.S. Home Sales Slump Continues in January
- Average Americans Spend 38 Percent of Monthly Income on Mortgage Payments
- Switzerland's Safe-Haven Appeal Grows with World's Wealthy Homebuyers
- U.S. Builder Confidence Rapidly Declines in February
- Las Vegas Home Sales Rise 6.7 Percent Annually in January, Condo Sales Dip
- Homebuyer Demand in America Drops to 5-Year Low in Early 2025
- Ownership More Affordable Than Renting in Most U.S. Markets
- The World's First Global Listings Service Launches, Called a GLS
- Home Prices Continue to Rise in 89 Percent of U.S. Metros in Late 2024
- Global Luxury Residential Prices Showed Gradual Improvement in Late 2024
- U.S. Construction Hiring Rate Drops to Lowest Levels in 5 Years


