Residential Real Estate News
U.S. Home Price Appreciation Accelerated in February
Marking 8 consecutive months of growth says CoreLogic's S&P Case-Shiller Index
Like many economic metrics, the journey toward stabilizing the U.S. housing market is fraught with challenges. Although there has been a modest recovery in home sales and inventories from last year's lows, elevated mortgage rates continue to hamper affordability, deterring many potential buyers. Despite a surge in new listings across various markets, pending home sales have only seen a slight increase, about 5% to 7% higher than last year through March 2024.
Examining broader housing market indicators, such as days on the market and sales-to-list price ratios, the trends remain largely consistent with the previous year. This consistency indicates that lower mortgage rates and a deceleration in home price growth are necessary to further unlock market activity. However, a persistent mismatch between supply and demand ensures that home price growth remains robust, with monthly increases trending upward. Last spring showcased a similar pattern, with home prices spiking in the season and stabilizing thereafter. According to CoreLogic's Home Price Index (HPI), home prices are projected to continue rising, with an average increase of over 4% anticipated for the year.
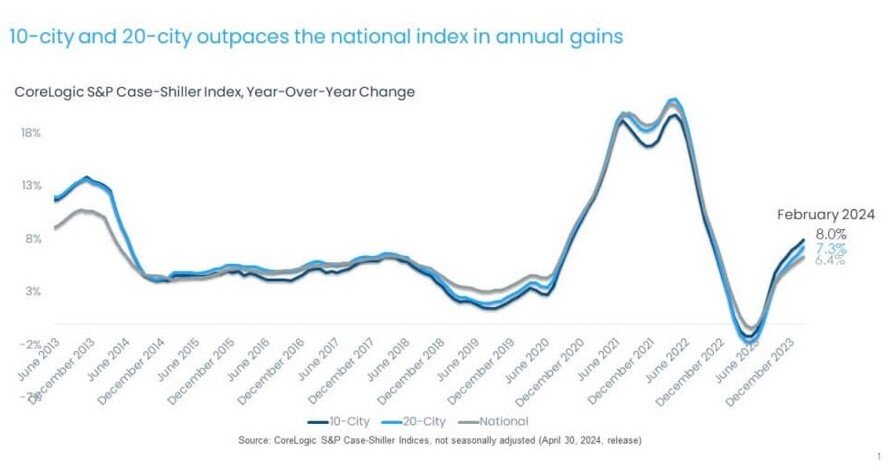
In February 2024, the CoreLogic S&P Case-Shiller Index reported a 6.4% year-over-year increase, marking eight consecutive months of annual growth. By 2023, home prices had rebounded, registering a 1.3% rise from the peak in June 2022.
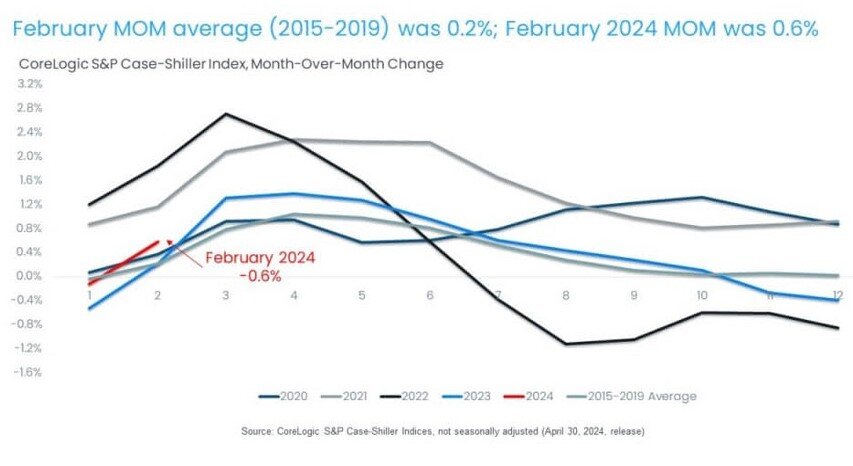
Despite the drag of high mortgage rates on sales, the non-seasonally adjusted month-over-month index for February rose by 0.6%, a substantial leap compared to the 0.2% average increase from 2015 to 2019. Even in the previous spring, when seasonal trends typically amplify home price growth, February's increase was only 0.2%.
CoreLogic Chief Economist Dr. Selma Hepp had this to say about the latest data, "As with many economic indicators, the road to normalizing housing markets remains windy. While home sales and inventories are improving over last year's bottom, higher mortgage rates continue to challenge affordability and keep many potential buyers on the sidelines. Still, given the persistent imbalance between buyers and sellers, home price growth remains solid and monthly gains march higher despite slowing of annual acceleration which simply reflects comparison with particularly strong gains in spring of 2023."
Both the 10-city and 20-city composite indexes recorded their eighth consecutive month of year-over-year gains in February, climbing 8% and 7.3%, respectively. These indexes include metro areas like New York and Chicago, which have experienced relatively strong market performance since mid-2022, partly due to the resurgence of urban living and office work. Many of these metros are now catching up with the home price gains seen in regions that boomed during the pandemic. Among the top 100 largest metro areas, those in the Northeast, particularly around New York City, are leading in home price appreciation this year.
When adjusted for inflation, which shows signs of easing, the 10-city composite index is marginally above its 2006 level by 1%, and the 20-city composite index is 6% higher than its 2006 peak. Nationally, adjusted home prices are 15% higher than in 2006.
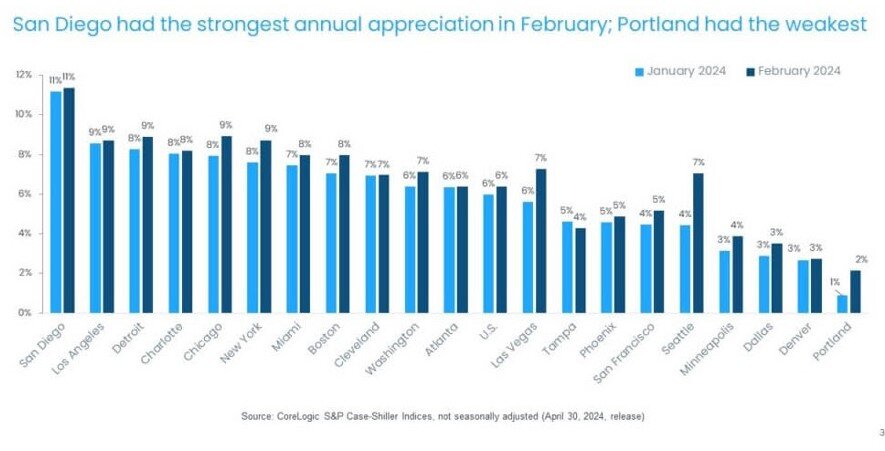
In February, 19 of the 20 U.S. metros analyzed experienced quicker price growth year over year compared to the previous month, though this still reflects a low base effect from early 2023. Tampa, Florida, was the sole metro where annual gains decelerated from the prior month.
Leading the 20-city index were San Diego, Chicago, and Detroit, with significant annual gains. Most metros saw year-over-year price increases surpassing the national average of 6.4%. San Diego, for example, logged a second consecutive month of double-digit annual increases.
The strongest yearly price accelerations were predominantly in the Western U.S. and the Northeast, with Seattle, Las Vegas, and New York at the forefront. Portland, Oregon remains the slowest appreciating market, with only a 2% increase compared to last year.
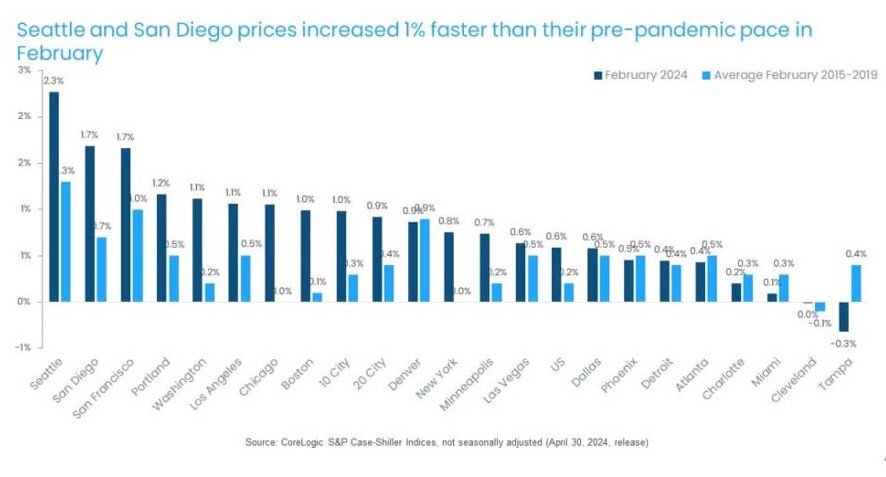
Nationally, home prices rose by 0.6% from January to February, with 16 metros showing stronger monthly gains. This compares with the monthly changes recorded in February across different years between 2015 and 2019.
Seattle, San Diego, and San Francisco recorded the largest monthly gains. Conversely, Tampa was the only market to see a monthly decline, partly mitigated by an influx of new listings this spring. Midwestern metros, including Cleveland and Detroit, despite robust growth into 2024, showed cooler February figures. The affordability crunch, exacerbated by high mortgage rates, particularly affected more affordable Midwestern metros. Additionally, Miami's market remains subdued this spring, as Florida grapples with not just high home prices but also escalating homeowners' and flood insurance costs.
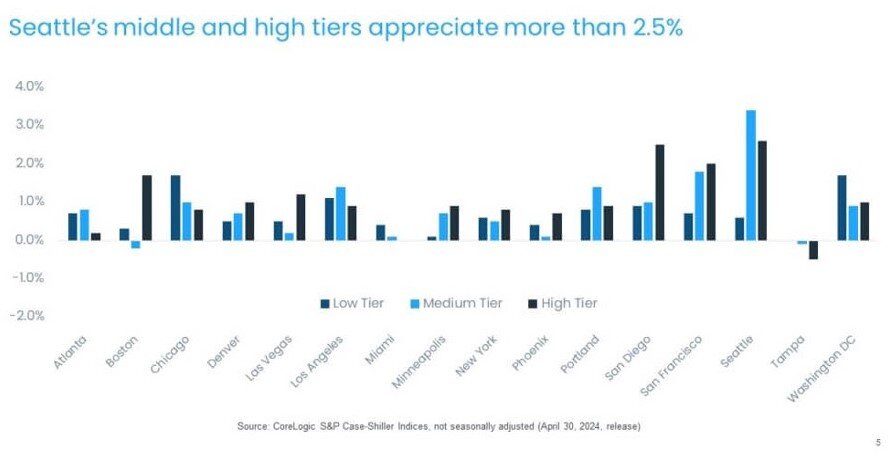
February's month-over-month appreciation varied by price tier and location, highlighting shifting demand across the country. In contrast to the subdued conditions seen the previous month, most metros and price tiers witnessed price increases. Tampa again saw declines, particularly in higher-tier homes. High-tier home prices saw the most significant rise on average, followed closely by middle and low tiers.
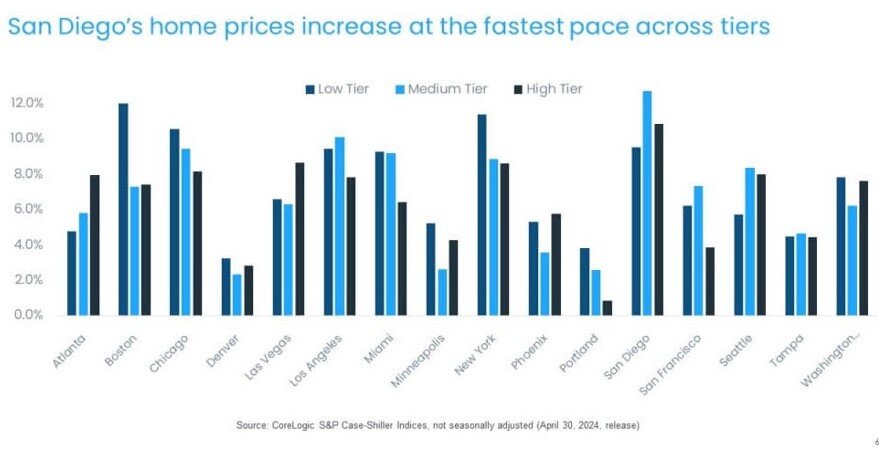
Over the year, low-tier homes appreciated the fastest, followed by high-tier homes. San Diego led overall price increases, while low-tier homes in Boston, Chicago, and New York saw the highest appreciation rates.