Residential Real Estate News

Active U.S. Residential Listings Spike 22 Percent in December
Residential News » Los Angeles Edition | By Michael Gerrity | January 6, 2025 8:35 AM ET
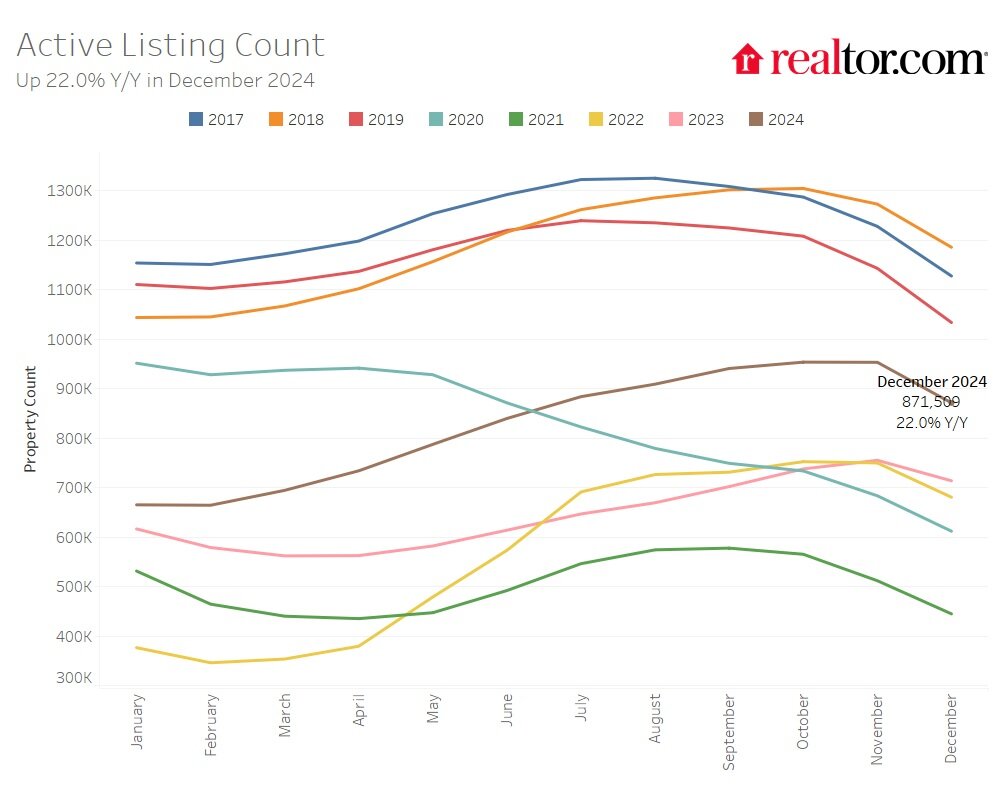
According to Realtor.com, the number of homes actively for sale in the U.S. grew by 22% in December 2024 compared to the previous year, marking the 14th consecutive month of growth. However, seasonal trends caused inventory levels to drop to their lowest point since June 2024.
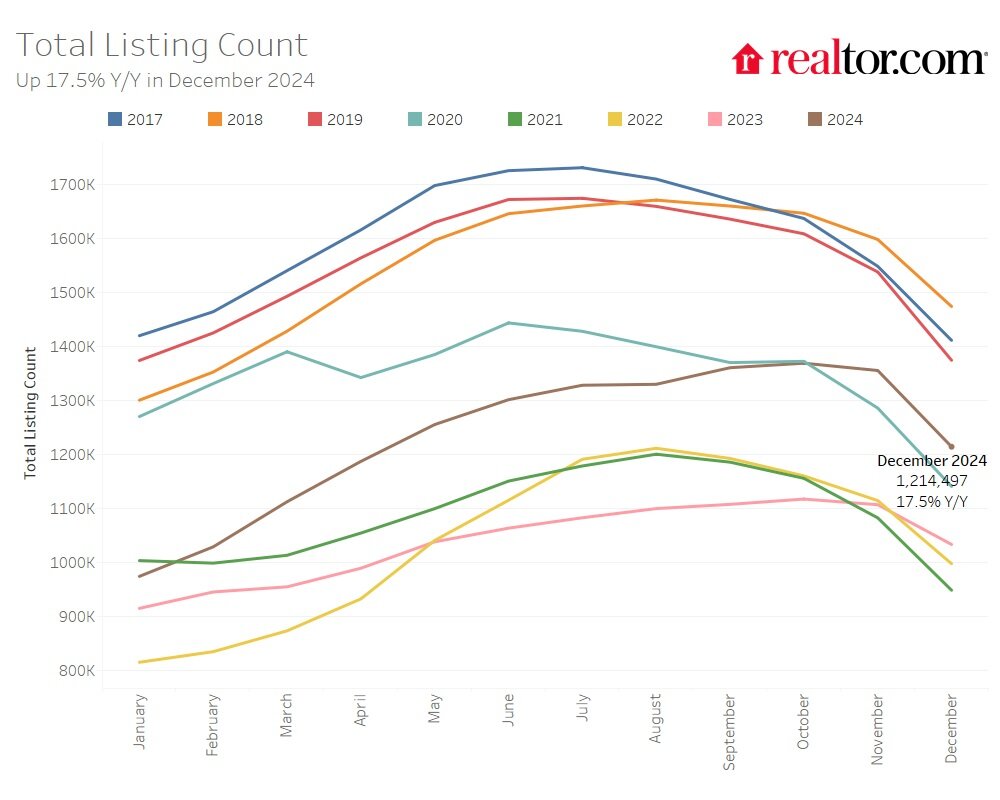
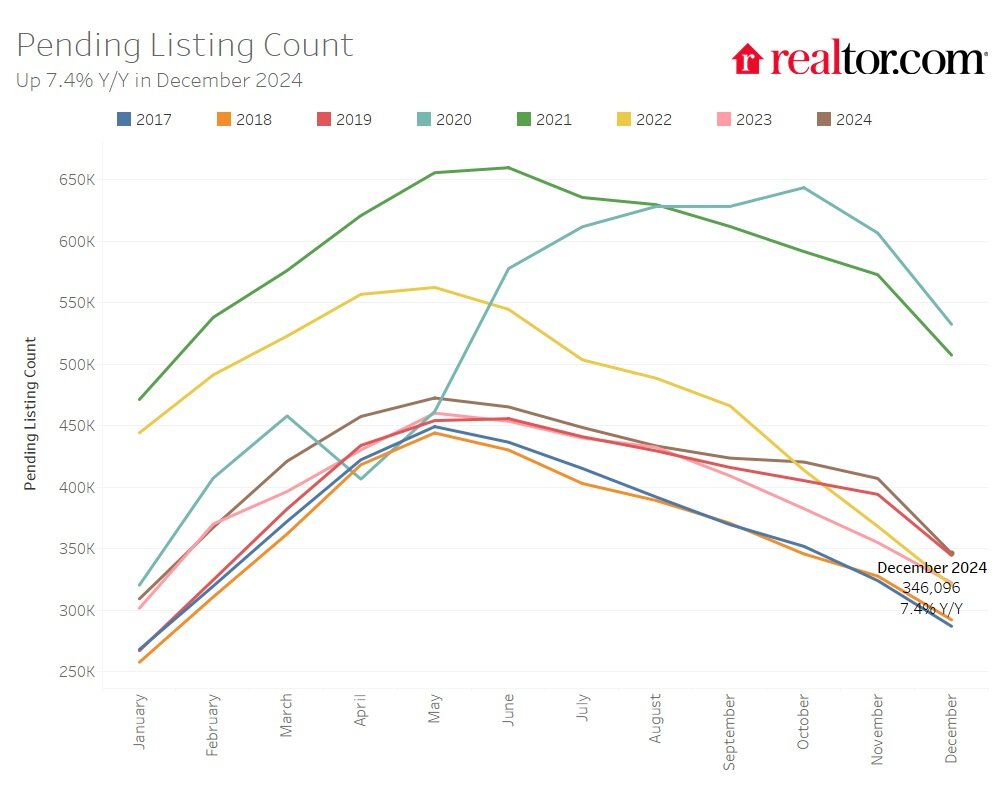
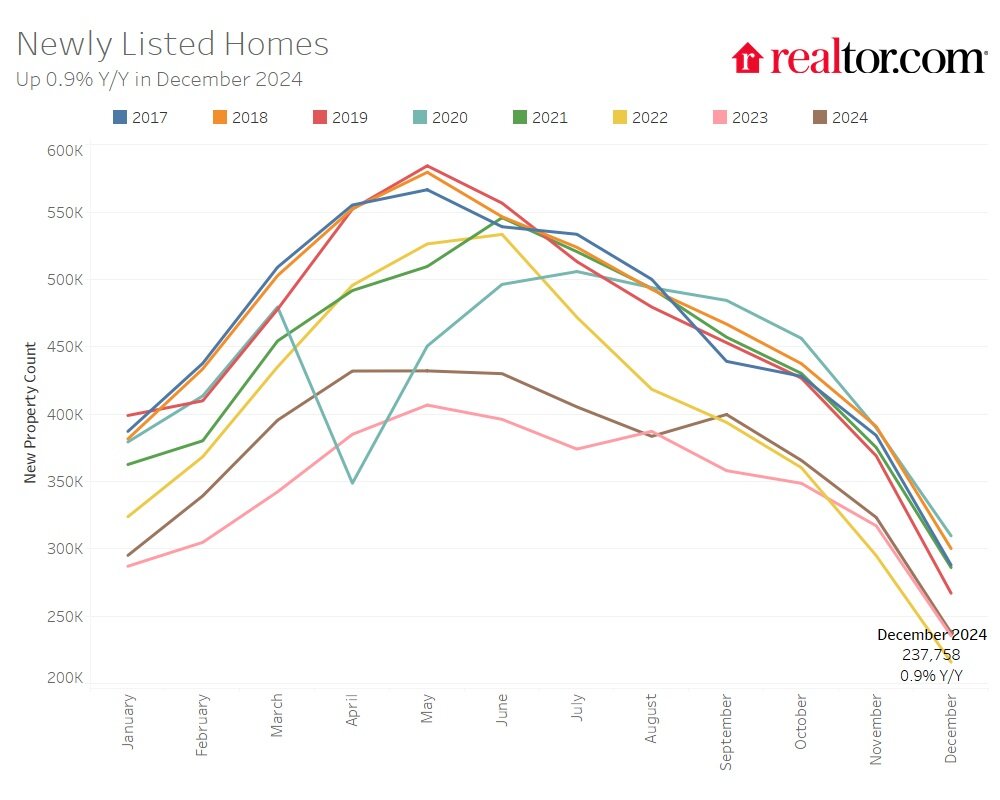
Total unsold homes, including pending sales, increased by 17.5% year-over-year, representing the 12th straight month of annual growth. This growth was slower than November's 22.5%. New listings rose slightly by 0.9% year-over-year, a decrease from November's 2% increase.
The median list price decreased by 1.8% year-over-year to $402,502, while the price per square foot rose by 1.3%, reflecting a growing share of smaller, more affordable homes in the market. Compared to December 2019, list prices have risen by 34.2%, and the price per square foot has increased by 49.5%, says Realtor.com.
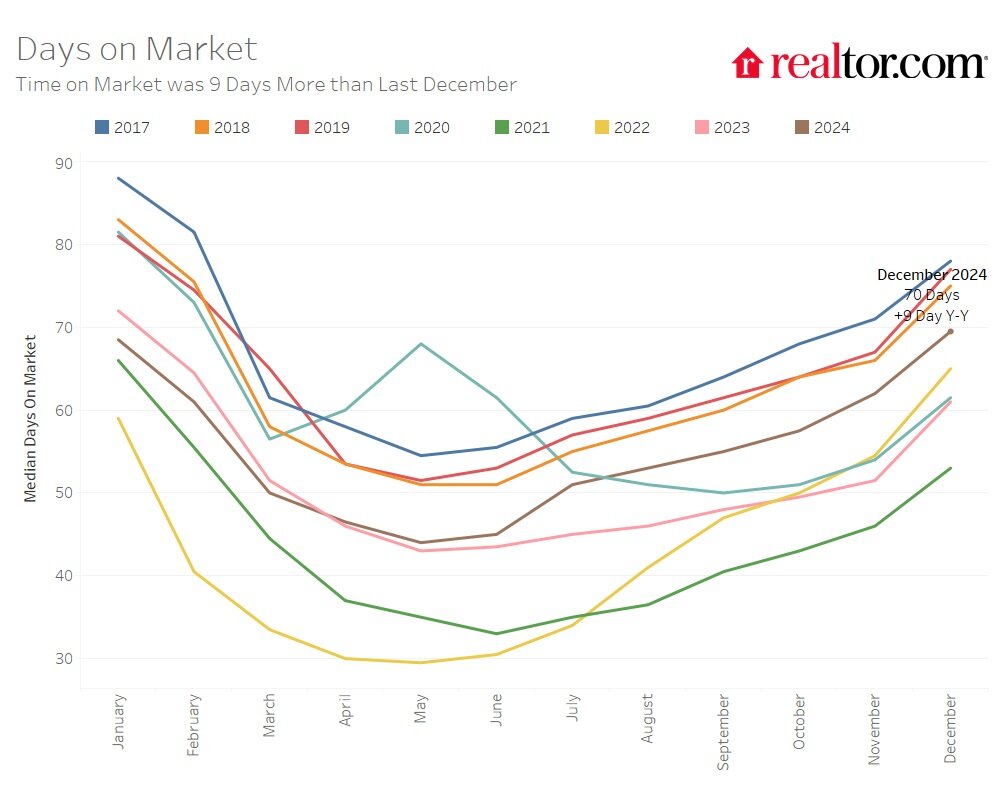
Homes spent an average of 70 days on the market in December, which is nine days longer than last year and eight days longer than November. Despite this slowdown, homes are still selling eight days faster than the pre-pandemic December average from 2017 to 2019.
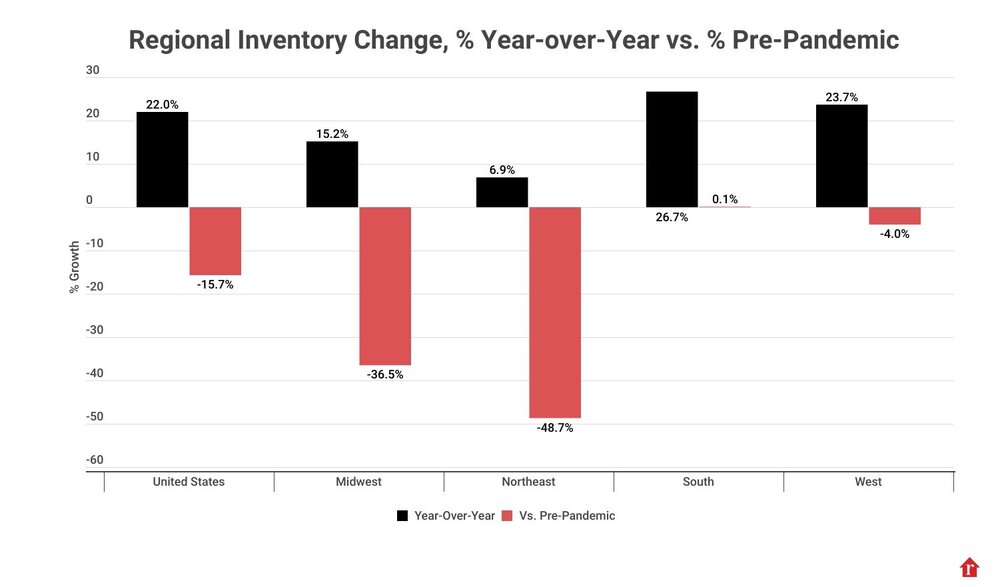
Active inventory grew across all regions, with increases of 26.7% in the South, 23.7% in the West, 15.2% in the Midwest, and 6.9% in the Northeast. Compared to pre-pandemic levels, the South's inventory slightly exceeded 2017-2019 averages by 0.1%, while the West, Midwest, and Northeast showed deficits of 4%, 36.5%, and 48.7%, respectively.
Inventory grew in 49 of the 50 largest metro areas, with Miami (45.4%), Orlando (42.4%), and Denver (41.9%) leading. Only 16 metros had higher inventory levels than pre-pandemic, led by Memphis (37.7%), Austin (36.5%), and Orlando (34.9%).
Price reductions were stable at 12.9% of listings, a slight increase from 12.7% last year. This remains 2.4 percentage points higher than the 2017-2019 average. Higher mortgage rates in November and December reduced homebuyer power, slowing market activity. Modest growth in home sales (1.5%) is expected in 2025 as rates stabilize.
Realtor.com reports listing prices rose slightly in the Midwest (0.7%) and Northeast (0.4%) but declined in the West (-1.3%) and South (-2.3%). The largest metro-level price increases were seen in Cleveland (9.1%), Milwaukee (6.7%), and Detroit (6.2%). Since 2019, the Hartford and New York metros have seen the highest price-per-square-foot growth at 66.8%, while San Francisco (17.9%) and San Jose (24.0%) lagged.
Homes in the South and West spent an additional 10 and 8 days on the market, respectively, compared to last year, while the Midwest and Northeast saw increases of 4 and 5 days. Nationally, 46 of the 50 largest metros experienced longer market times compared to last year, with the biggest increases in Nashville (22 days), Orlando (21 days), and Rochester (21 days).
Sign Up Free | The WPJ Weekly Newsletter
Relevant real estate news.
Actionable market intelligence.
Right to your inbox every week.
Real Estate Listings Showcase
Related News Stories
Residential Real Estate Headlines
- Ireland Home Prices Spike 9 Percent in 2024
- More Americans Opting for Renting Over Homeownership in 2024
- BLOCKTITLE Global Property Tokenization Platform Announced
- Small Investors Quietly Reshaping the U.S. Housing Market in Late 2024
- Greater Miami Overall Residential Sales Dip 9 Percent in November
- U.S. Home Sales Enjoy Largest Annual Increase in 3 Years Post Presidential Election
- U.S. Housing Industry Reacts to the Federal Reserve's Late 2024 Rate Cut
- U.S. Home Builders Express Optimism for 2025
- Older Americans More Likely to Buy Disaster-Prone Homes
- NAR's 10 Top U.S. Housing Markets for 2025 Revealed
- U.S. Mortgage Delinquencies Continue to Rise in September
- U.S. Mortgage Rates Tick Down in Early December
- Post Trump Election, U.S. Homebuyer Sentiment Hits 3-Year High in November
- Global Listings Aims to Become the Future 'Amazon of Real Estate' Shopping Platform
- Greater Las Vegas Home Sales Jump 15 Percent in November
- Ultra Luxury Home Sales Globally Experience Slowdown in Q3
- World Property Exchange Announces Development Plan
- Hong Kong Housing Market to Reach Equilibrium in Late 2025
- Construction Job Openings in U.S. Down 40 Percent Annually in October
- U.S. Mortgage Applications Increase in Late October
- World Property Markets, World Property Media to Commence Industry Joint-Venture Funding Rounds in 2025
- New Home Sales Hit 2 Year Low in America
- U.S. Pending Home Sales Increase for Third Consecutive Month in October
- Pandemic-led Residential Rent Boom is Now Fizzling in the U.S.
- Emerging Global Real Estate Streamer WPC TV Expands Video Programming Lineup
- 1 in 5 Renters in America Entire Paycheck Used to Pay Monthly Rent in 2024
- U.S. Home Sales Jump 3.4 Percent in October
- Home Buyers Negotiation Power Grows Amid Cooling U.S. Market
- Canadian Home Sales Surge in October, Reaching a Two-Year High
- Greater Orlando Area Home Sales Continue to Slide in October
- U.S. Mortgage Credit Availability Increased in October
- U.S. Mortgage Rates Remain Stubbornly High Post Election, Rate Cuts
- Construction Input Prices Continue to Rise in October
- BETTER MLS: A New Agent and Broker Owned National Listings Platform Announced
- Home Prices Rise in 87 Percent of U.S. Metros in Q3
- Caribbean Islands Enjoying a New Era of Luxury Property Developments
- The World's First 'Global Listings Service' Announced
- Agent Commission Rates Continue to Slip Post NAR Settlement
- Market Share of First Time Home Buyers Hit Historic Low in U.S.
- Greater Palm Beach Area Residential Sales Drop 20 Percent Annually in September
