Real Estate News

Miami Leads the Nation in Rising Home Prices, Up 17 Percent Annually in August
» Miami Edition | By Michael Gerrity | September 4, 2023 7:52 AM ET
Driven by low inventory, nationwide home price rose 5 percent annually in August
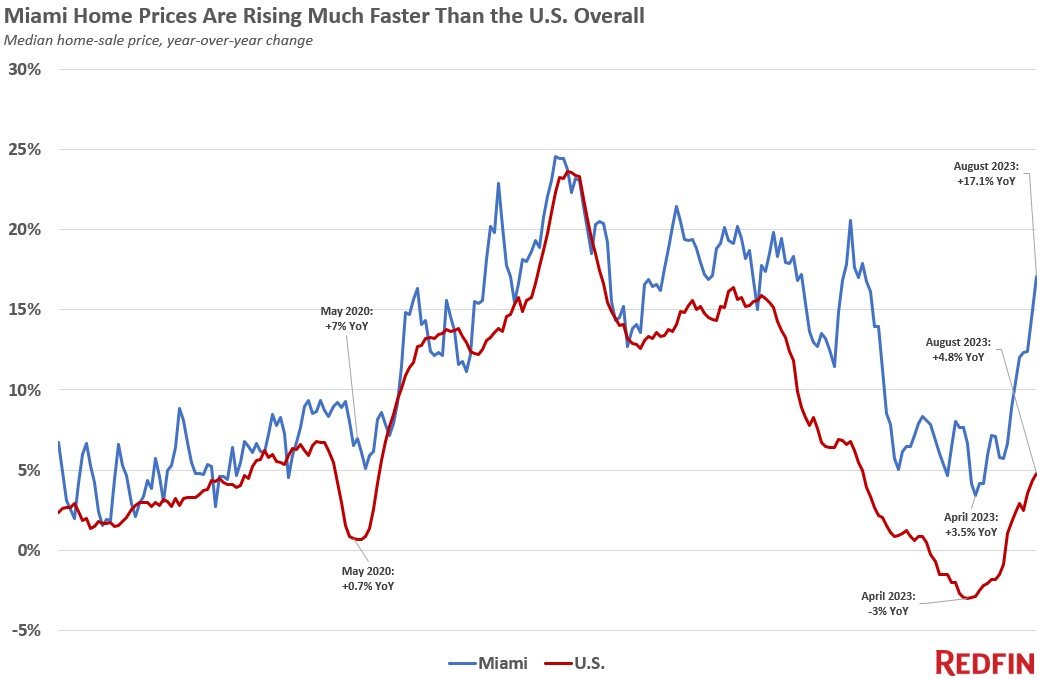
National property broker Redfin is reporting that the median home-sale price in Miami rose 17% from a year earlier during the four weeks ending August 27, 2023, the biggest increase the metro area has seen since October 2022.
That's also the biggest increase of the 50 most populous U.S. metros, though almost all of those metros posted year-over-year price gains in August. Prices declined in just six metros, half of them in Texas: Austin, Phoenix, Portland, OR, Fort Worth, Las Vegas and San Antonio.
Nationwide, the median home-sale price rose 5% year over year to $380,000, the biggest uptick in 10 months. The typical monthly mortgage payment hit an all-time high of $2,649.
Home prices are rising due to a severe inventory shortage: The total number of U.S. homes for sale is down 19%, the biggest drop since February 2022, and new listings are down 10%. Supply is low because homeowners are hanging onto their low mortgage rates; nearly all homeowners have a rate below 6%, and rates are now hovering around 7%. The lack of homes for sale is causing competition for desirable homes despite high mortgage rates and a relatively small pool of buyers. Pending sales declined 14% year over year and mortgage-purchase applications declined 27%, hovering near their lowest level in about 30 years. Another reason for the big year-over-year price increase is that prices came down rapidly at this time last year, with rising mortgage rates sidelining buyers.
Miami's outsized home-price increase is a slightly different story. Unlike most U.S. metros, Miami prices never posted an annual drop in the first half of 2023, as elevated mortgage rates were deterring many homebuyers. That's partly because Miami has a supply shortage, like the rest of the country. But it's also because Miami attracts an influx of out-of-town buyers and investors, despite increasing risk of climate-driven natural disasters such as hurricanes and flooding. Those buyers are often undeterred by high mortgage rates because they pay cash; two in five recent Miami homebuyers paid all cash.
Leading indicators of homebuying activity:
- The daily average 30-year fixed mortgage rate was 7.06% on August 30, down from a peak of 7.49% a week earlier. For the week ending August 24, the average 30-year fixed mortgage rate was 7.23%, up from 7.09% a week earlier and the highest level in more than 20 years.
- Mortgage-purchase applications during the week ending August 25 increased 2% from a week earlier, seasonally adjusted. Purchase applications were down 27% from a year earlier.
- The seasonally adjusted Redfin Homebuyer Demand Index-a measure of requests for tours and other homebuying services from Redfin agents-was up just slightly (about 1%) from a month earlier. It was down 4% from a year earlier.
- Google searches for "homes for sale" were down 9% from a month earlier during the week ending August 26, and down about 19% from a year earlier.
- Touring activity as of August 27 was up flat from the start of the year, compared with an 8% decline at the same time last year, according to home tour technology company ShowingTime.
Key housing market takeaways for 400+ U.S. metro areas:
- The median home sale price was $379,975, up 4.8% from a year earlier. That's the biggest increase since October.
- Sale prices increased most in Miami (17.1% YoY), Newark, NJ (16.1%), San Diego (12.3%), Milwaukee (12.1%) and Providence, RI (11%).
- Home-sale prices declined in just six metros: Austin, TX (-8.7% YoY), Phoenix (-2.4%), Portland, OR (-1.4%), Fort Worth, TX (-1.3%), Las Vegas (-1.2%) and San Antonio, TX (-0.5%).
- The median asking price of newly listed homes was $383,706, up 3.7% from a year earlier. That's the biggest increase since November.
- The monthly mortgage payment on the median-asking-price home was a record-high $2,649 at a 7.23% mortgage rate, the average for the week ending August 24. That's up 18% from a year earlier.
- Pending home sales were down 14.4% year over year, continuing a 15-month-plus streak of double-digit declines.
- Pending home sales fell in all of the metros Redfin analyzed. They declined most in Boston (-30% YoY), Cleveland (-29.9%), Seattle (-29.2%), New Brunswick, NJ (-28.7%) and Sacramento (-27.6%).
- New listings of homes for sale fell 10.4% year over year. That's a substantial decline, but the smallest in about a year. Part of the reason for the shrinking decline is that new listings fell swiftly at this time in 2022.
- New listings declined in all but two of the metros Redfin analyzed. They fell most in Atlanta (-32% YoY), Las Vegas (-27.5%), Cleveland (-26.7%), Sacramento (-21.4%) and Riverside, CA (-20.9%). They increased in Milwaukee (6.1%) and San Jose, CA (4.3%).
- Active listings (the number of homes listed for sale at any point during the period) dropped 18.7% from a year earlier, the biggest decline since February 2022. Active listings were down slightly from a month earlier; typically, they post month-over-month increases at this time of year.
- Months of supply--a measure of the balance between supply and demand, calculated by the number of months it would take for the current inventory to sell at the current sales pace--was 2.9 months, the highest level since April. Four to five months of supply is considered balanced, with a lower number indicating seller's market conditions.
- 40.8% of homes that went under contract had an accepted offer within the first two weeks on the market, on par with the share a year earlier.
- Homes that sold were on the market for a median of 29 days, on par with 28 days a year earlier.
- 34.1% of homes sold above their final list price, down just slightly from 36% a year earlier.
- On average, 6.2% of homes for sale each week had a price drop, the highest share since November and roughly the same as a year earlier.
- The average sale-to-list price ratio, which measures how close homes are selling to their final asking prices, was 99.7%, the lowest level in three months. It's about on par with a year earlier.


