Commercial Real Estate News

Phoenix, Orange County and Inland Empire Emerge as Leading U.S. Industrial Markets
In the final quarter of 2024, industrial real estate remained one of the most stable segments within commercial real estate, according to CommercialCafe. Development pipelines slowed across most markets, while vacancies continued to rise at a controlled pace. As a result, the market trend in Q4 2024 focused on absorbing the record-breaking industrial developments of recent years.
Key U.S. Industrial Market Insights:
- Overall Market: Phoenix maintained its position as the leading industrial real estate market, with Orange County and the Inland Empire in California rounding out the top three.
- Average Rent: All 30 major markets experienced annual increases in asking rents, with Orange County posting the highest nationwide average at $16.2 per square foot.
- Vacancy Rates: Orange County was one of only five major markets to see a decline in vacancies quarter-over-quarter, achieving the lowest rate in the study at 4.2% in Q4.
- Industrial Construction: Across the 30 major markets, 34.5 million square feet of industrial space was delivered in Q4, with an additional 188.2 million square feet under construction. Phoenix led in both Q4 deliveries and active pipeline projects.
- Average Sale Price: The Bay Area remained the most expensive market for industrial space, with an average sale price of $458.40 per square foot, followed by Orange County, Los Angeles, and the Inland Empire.
- Loan Maturities: Portland, Oregon, had the lowest share of industrial real estate loans maturing in 2025, followed by Bridgeport, Connecticut, and Baltimore.
- Search Trends: Houston recorded the highest online search volume for industrial real estate keywords in Q4, while Boston experienced the greatest year-over-year growth in search interest.
Peter Kolaczynski, Director at CommercialCafe, noted, "Industrial space, which was scarce in 2021 and 2022, has become significantly more accessible. By December 2024, the national industrial vacancy rate had risen to 8%, a sharp increase from sub-4% levels two years prior. Port markets such as the Inland Empire saw even greater shifts, from below 2% in 2022 to 7.8% in December 2024. Projections indicate vacancy rates will plateau in early 2025 before gradually declining in the latter half of the year as supply is absorbed and new developments slow."
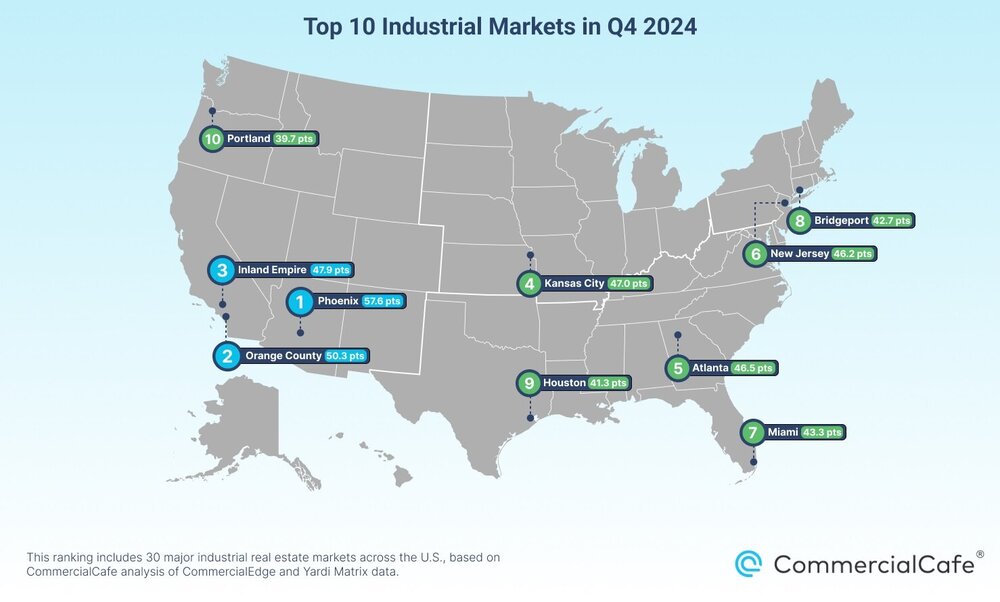
Top 10 U.S. Industrial Markets in Q4 2024
- Phoenix, AZ retained its position as the top-performing industrial market, leading in Q4 deliveries (7.16 million square feet), inventory expansion (1.88%), and projected pipeline growth (5.75%). Despite its strong market fundamentals, Phoenix also saw a pipeline slowdown, dropping from 32.6 million square feet in Q3 to 22.3 million in Q4.
- Orange County, CA surged eight spots from Q3, securing second place with a 4.2% vacancy rate--the lowest among the 30 markets studied. The market also recorded an 8.1% year-over-year rent increase, reinforcing its status as the most expensive industrial rental market at $16.2 per square foot.
- Inland Empire, CA climbed four positions, with industrial property sales averaging $264 per square foot by December 2024, up from $248 the previous year. Online search interest for industrial space increased by 33% year-over-year.
- Kansas City, MO moved up in the rankings due to a declining vacancy rate (4.9%, the third-lowest in the study) and a growing construction pipeline, which expanded from 10.7 million square feet in Q3 to 11.5 million in Q4. Yearly rents rose by 5% to $5.1 per square foot.
- Atlanta, GA maintained its Q3 ranking, with industrial rents rising nearly 10% year-over-year and a vacancy rate of 6.8%. Q4 deliveries added 2.2 million square feet to the market, with an additional 8 million square feet in the pipeline.
- New Jersey remained the Northeast's most expensive industrial rental market, with an average asking rent of $11.4 per square foot, reflecting a 12.7% annual increase. The market added 3.25 million square feet of industrial space in Q4, with 5.5 million more under construction.
- Miami, FL recorded the highest annual rent growth at nearly 15%, reaching an average asking rent of $12.3 per square foot. However, vacancy rates rose by 340 basis points between Q3 and Q4, signaling a shift in market conditions.
- Bridgeport, CT ranked eighth, with a Q4 vacancy rate of 4.7%, the second-lowest among the 30 markets. Although vacancy rates increased slightly from Q3, Bridgeport remained one of the tightest industrial markets in the country.
- Houston, TX secured ninth place, driven by strong online search interest, which surged over 60% year-over-year. While the vacancy rate exceeded 7%, industrial space deliveries in Q4 expanded the market by only 0.2%.
- Portland, OR rounded out the top 10, with a 7.2% annual rent increase and a 130-basis-point vacancy rise since Q3. The market also had the lowest percentage of industrial loans maturing in 2025, at just 4.3%.
As 2025 approaches, the industrial real estate sector is expected to stabilize, with vacancy rates leveling off before a gradual decline later in the year. While market conditions continue evolving, key regions such as Phoenix, Orange County, and the Inland Empire remain dominant players in the industrial landscape.