Residential Real Estate News

Homebuyer Demand in America Drops to 5-Year Low in Early 2025
U.S. Housing Supply Hits Highest Levels Since 2020
According to national brokerage Redfin, U.S. homebuyers currently have the most options available since 2020. However, rising housing costs are deterring many from making purchases, making monthly mortgage payments increasingly difficult.
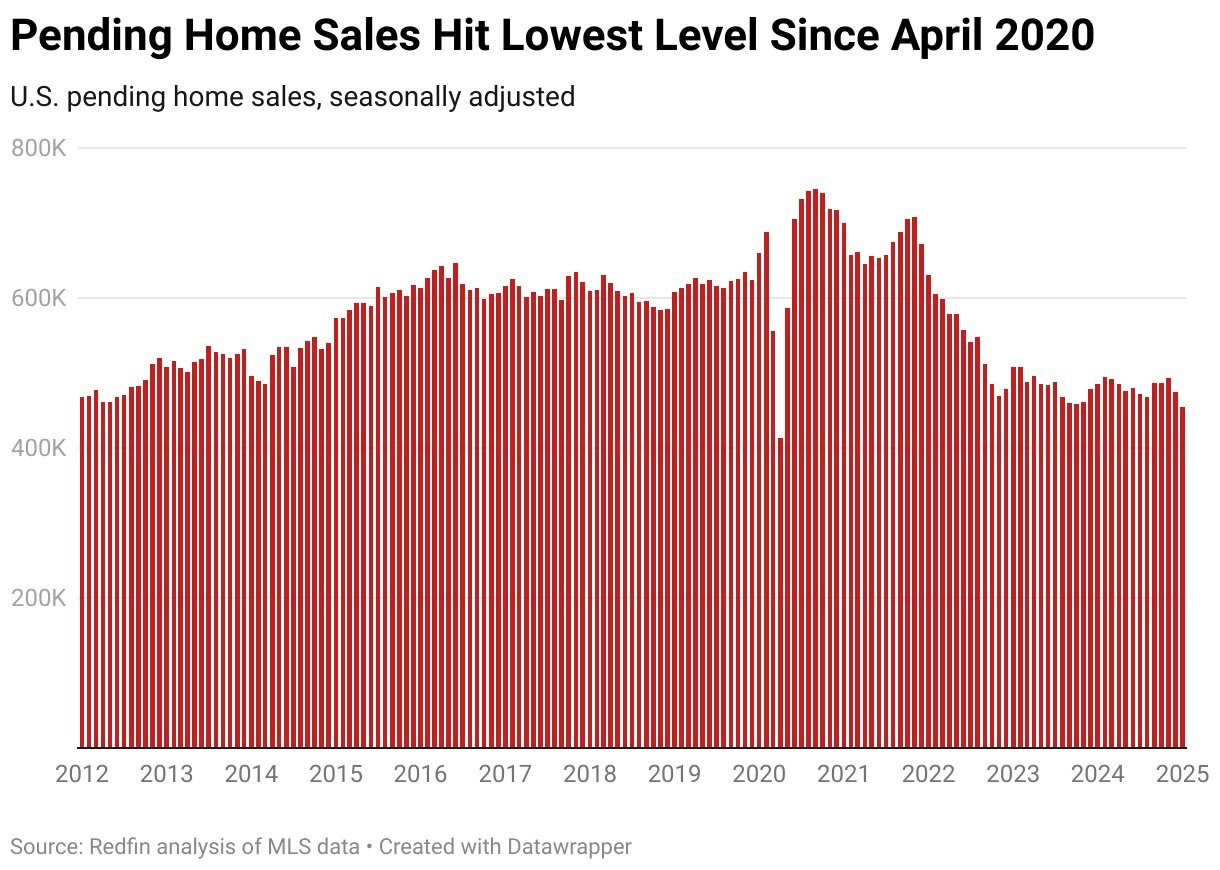
In January 2025, pending U.S. home sales dropped to their lowest level on record, aside from the early pandemic period. They declined 4.2% from the previous month -- the steepest seasonally adjusted drop since August 2023 -- and fell 6.3% year over year.
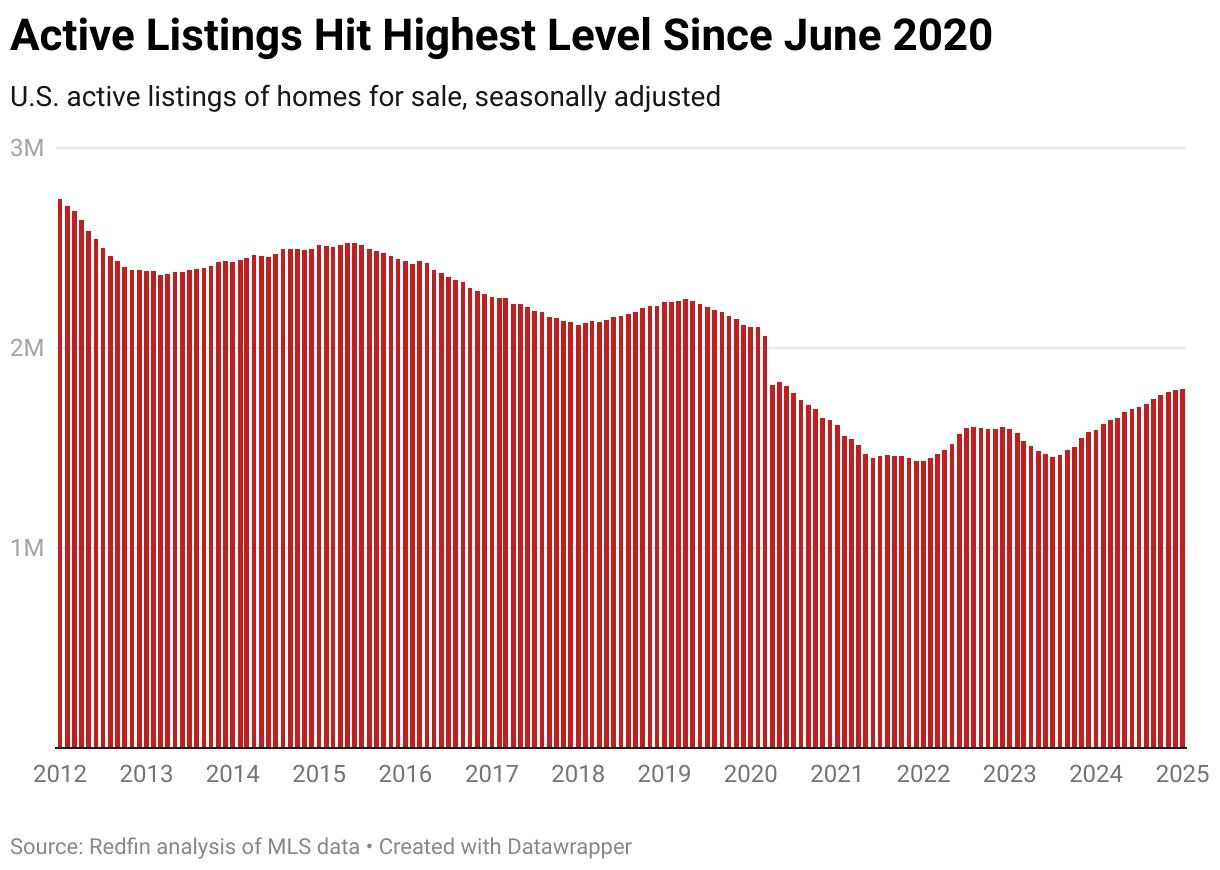
Meanwhile, active home listings reached their highest point since the early days of the pandemic. They inched up 0.3% month over month and surged 12.9% compared to last year. New listings also hit their highest level since July 2022, rising 1.9% from December and 4.7% year over year.
Why Housing Supply is Increasing
Several factors are contributing to the rise in available homes:
- Mortgage rate lock-in effect is easing. Many homeowners who secured historically low mortgage rates during the pandemic had been reluctant to sell, fearing higher rates on a new loan. However, staying put indefinitely isn't always an option.
- Homes are sitting on the market longer. The typical home sold in January spent 56 days on the market--seven days longer than a year ago and the longest for any January since 2020.
- Demand is weakening. Fewer buyers mean more unsold homes. Existing home sales fell 1.7% in January to a seasonally adjusted annual rate of 4.3 million -- the biggest monthly decline since October 2023.
Why Housing Demand is Declining
On the flip side, several factors are making it harder for buyers to commit:
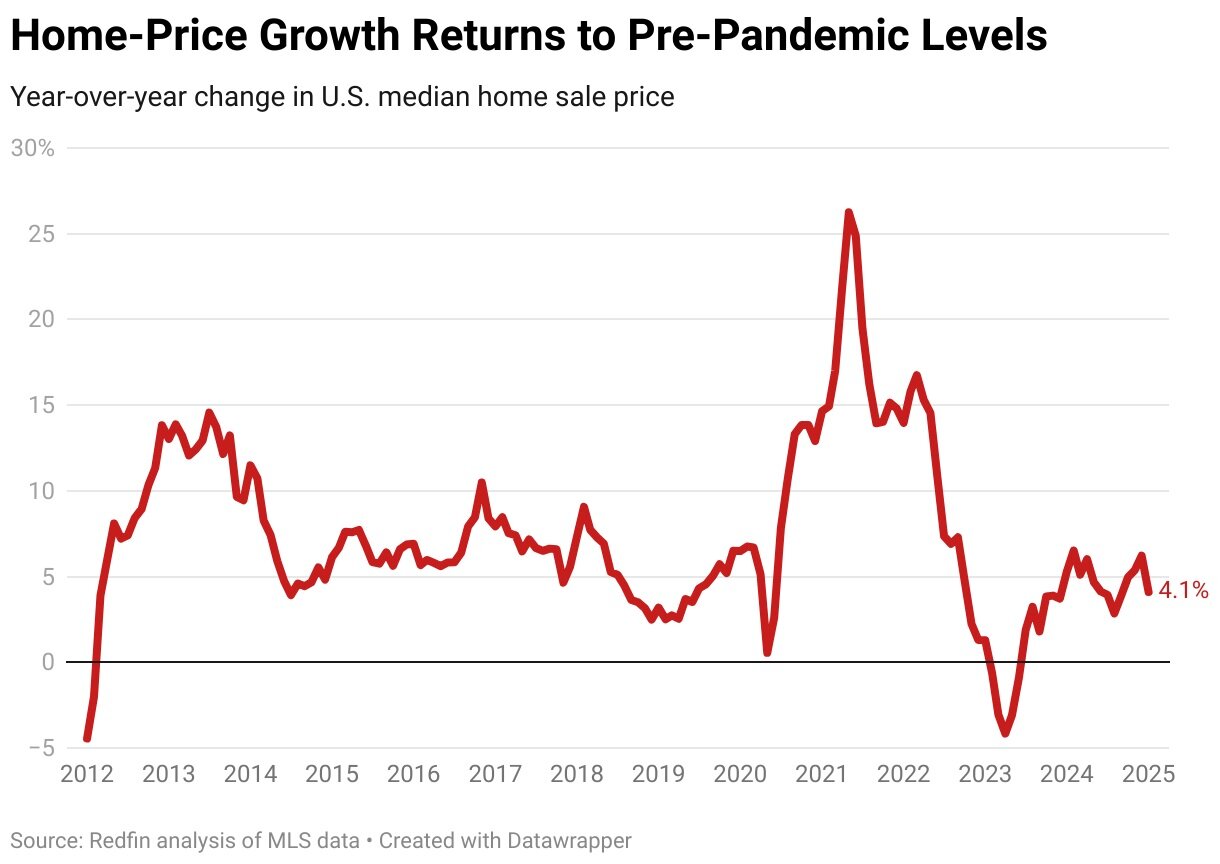
- Mortgage rates hit an eight-month high. The average 30-year fixed mortgage rate reached 6.96% in January, up from 6.72% the previous month and the highest level since May. Meanwhile, the median home price climbed 4.1% year over year to $418,581 -- 45% higher than in January 2020.
- More deals are falling through. Approximately 41,000 home-purchase agreements were canceled in January -- 14.3% of all contracts signed that month and the highest January rate on record since 2017.
- Economic uncertainty. Factors like potential tariffs, federal workforce reductions, return-to-office mandates, and fluctuating mortgage rates are making both buyers and sellers hesitant.
A Changing Market: Insights from Agents
"I'm seeing a lot more inventory hit the market than in past years, but it's still not enough," said Charles Wheeler, a Redfin Premier real estate agent in San Diego. "Economic concerns are front and center for many people. Some sellers feel like we're at the top of the market and are cashing out to reinvest elsewhere. Buyers should know they have more negotiating power now, while sellers should focus on pricing competitively and presenting their homes well."
Though home prices continue to rise, growth has returned to pre-pandemic levels of around 4%-5% annually, a shift from the double-digit gains seen in 2021-2022. This moderation is partly due to a more balanced supply-and-demand dynamic, as more listings hit the market. However, prices remain high because the overall housing supply is still insufficient.
"Nationally, we're seeing an increase in sellers and a decrease in buyers, which is bringing supply and demand closer to balance," said Redfin Senior Economist Elijah de la Campa. "But this trend varies widely by region. In expensive coastal markets like San Jose and Seattle, pending sales are rising, while in former pandemic boomtowns like Miami and Austin, they're seeing double-digit declines. Newark has near-record-low inventory, whereas San Antonio has near-record-high listings."
Additionally, winter storms in January 2025 may have dampened sales activity in some areas.
Metro-Level Highlights: January 2025
Home Prices (Year-over-Year Change)
- Biggest Increases: Pittsburgh (+15.4%), St. Louis (+13.2%), Anaheim, CA (+13.1%)
- Biggest Declines: Tampa, FL (-4%), Austin, TX (-3.7%), San Francisco (-2.2%), Jacksonville, FL (-1.3%)
Pending Sales (Year-over-Year Change)
- Biggest Gains: Portland, OR (+11.4%), San Jose, CA (+8.2%), Milwaukee (+4.7%)
- Biggest Drops: Detroit (-19.2%), Miami (-18.1%), Atlanta (-17.4%)
Closed Sales (Year-over-Year Change)
- Biggest Gains: Portland, OR (+12.8%), Providence, RI (+10%), Boston (+9.9%)
- Biggest Declines: Detroit (-11.3%), Miami (-9.4%), Fort Lauderdale, FL (-8.2%)
New Listings (Year-over-Year Change)
- Biggest Gains: Seattle (+30.8%), Oakland, CA (+27.7%), Sacramento, CA (+25%)
- Biggest Declines: Kansas City, MO (-11.2%), Detroit (-9.1%), Pittsburgh (-8.4%)
Active Listings (Year-over-Year Change)
- Biggest Increases: Oakland (+31.1%), Seattle (+29.1%), Cincinnati (+28.1%)
- Biggest Declines: New York (-3.9%), Newark, NJ (-1.9%), Chicago (-1.5%)
Homes Sold Above List Price
- Highest Share: Newark (56.7%), San Jose (52.7%), Nassau County, NY (49%)
- Lowest Share: West Palm Beach, FL (5.5%), Fort Lauderdale (5.9%), Miami (7.5%)