Residential Real Estate News
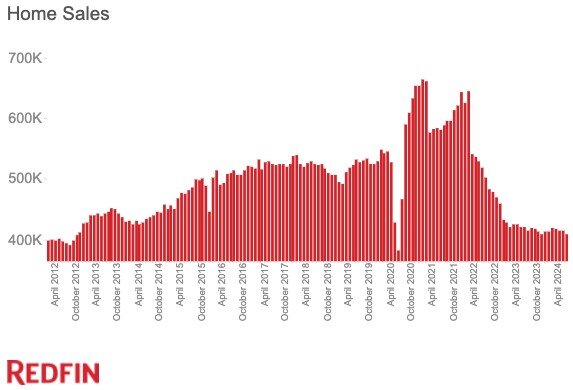
U.S. Homes Sales Fell to One of Lowest Levels on Record in May
According to Redfin, U.S. home sales fell 1.7% month over month in May 2024 on a seasonally adjusted basis and dropped 2.9% from a year earlier.
There have been just two months in the past decade with fewer home sales: October 2023, when mortgage rates jumped to a 23-year high, and May 2020, when the onset of the pandemic brought the housing market to a halt and home sales to a record low.
"Buyers today are facing many of the realities of a hot market even though few homes are changing hands," said Redfin Senior Economist Elijah de la Campa. "Sales are sluggish because high homebuying costs are making both house hunters and prospective sellers skittish. And with so few homes for sale, buyers in some markets are getting into bidding wars, which is helping push home prices to record highs."
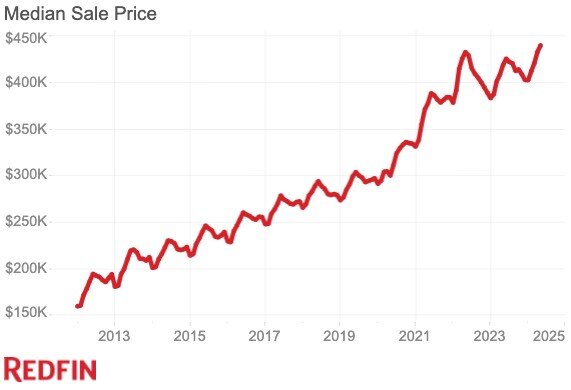
Home Prices Hit Another Record High in May, and Mortgage Rates Kept Climbing
The median home sale price rose 5.1% year over year in May to a record $439,716. The average 30-year-fixed mortgage rate hit 7.06%. That's up from 6.99% one month earlier and 6.43% one year earlier, and is more than double the all-time low of 2.68% during the pandemic. Daily average mortgage rates did drop to their lowest level in about three months this week after the latest CPI report showed that inflation is continuing to cool.
Even though homes are selling for more than ever before, many sellers are still having to lower their list prices after putting their homes on the market--one silver lining for buyers.
Nearly One of Every Five Homes for Sale Faced a Price Cut
Nearly one in five (19.2%) homes for sale in May had a price cut, up from 13.2% a year earlier and just shy of the 21.7% record high set in October 2022.
Some sellers are reducing their prices because they listed their home for too much initially and it ended up sitting on the market. The typical home for sale in May spent 32 days on the market. While that's comparable with a year earlier, it's the highest level for any May since the start of the pandemic.
Price drops are particularly common in areas where housing supply has been rising quickly, like Florida and Texas. In these areas, individual home sellers have been facing strong competition from homebuilders.
The Housing Shortage Is Improving, But Remains Severe
New listings rose 0.3% month over month in May on a seasonally adjusted basis and climbed 8.8% from a year earlier. Still, they were roughly 20% below pre-pandemic (May 2019) levels. That's largely because many homeowners don't want to sell, as they feel "locked in" by the low mortgage rate they scored during the pandemic.
Active listings, or the total number of homes for sale, rose 0.4% month over month on a seasonally adjusted basis and jumped 11.1% from a year earlier--the largest annual gain since the start of 2023. Still, active listings were about 25% below pre-pandemic levels.
While new listings represent the number of homes that were listed for sale during a given month, active listings represent the total number of homes that were for sale during a given month. That means that the latter metric includes homes that aren't selling. One reason active listings have risen so much is that in some areas, homes are lingering on the market and getting stale.
Active listings are also soaring along Florida's southwest Gulf Coast. In North Port, they surged 51.1% year over year on an unadjusted basis--the largest increase in the nation. Next came Tampa (46%) and Cape Coral (45.1%). Those housing markets are cooling faster than anywhere else in the country amid a new-construction boom, intensifying natural disasters and soaring insurance costs.
Meanwhile, many of the markets that are holding up best and seeing price increases--like Rochester, NY--are relatively affordable and have near-record-low supply.
Metro-Level Highlights: May 2024
- Prices: Median sale prices rose most from a year earlier in Anaheim, CA (17.6%) Cleveland (15.1%) and Nassau County, NY (14.2%). They fell most in Cape Coral, FL (-2.7%), Honolulu (-2.1%) and Austin, TX (-1.1%).
- Price cuts: In Indianapolis, 48.1% of listings had a price drop--a higher share than any other metro Redfin analyzed. Next came Tampa, FL (45.2%) and Denver (44.8%). The lowest shares were in Newark, NJ (13.4%), Lake County, IL (15%) and Milwaukee (15.2%). Note: Three of the 10 metros with the highest shares of price drops are in Florida and three are in Texas.
- New listings: New listings rose most in San Jose, CA (32.7%), Seattle (31.2%) and Denver (31.1%). They fell most in Atlanta (-7.7%), New Orleans (-4.4%) and Greensboro, NC (-4.3%).
- Active listings: Active listings rose most in North Port, FL (51.1%), Tampa (46%) and Cape Coral (45.1%). They fell most in New Brunswick, NJ (-8.1%), Chicago (-7.3%) and Raleigh, NC (-5.5%).
- Closed home sales: Home sales rose most in San Jose (16.6%), Minneapolis (11.7%) and San Francisco (10.5%). They fell most in Stockton, CA (-15.4%), Buffalo, NY (-15.3%) and San Antonio (-14.3%).
- Sold above list price: In Rochester, NY, 77.1% of homes sold above their final list price, the highest share among the metros Redfin analyzed. Next came San Jose (76.1%) and Oakland, CA (68.4%). The shares were lowest in North Port (5.9%), West Palm Beach, FL (8.1%) and Cape Coral (8.6%).