The WPJ
THE WORLD PROPERTY JOURNALReal Estate Facts Not Fiction
Commercial Real Estate News

New York City's 2011 Annualized Commercial Sales Up 80% Over Last Year
Commercial News » Commercial Real Estate Edition | By Michael Gerrity | October 24, 2011 8:30 AM ET
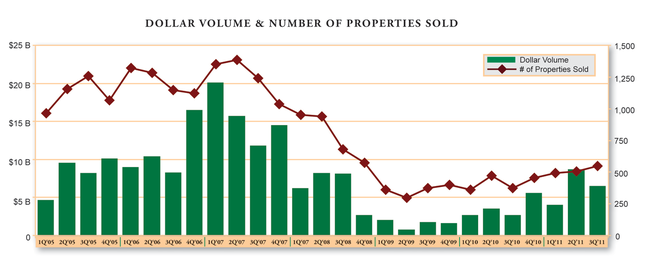
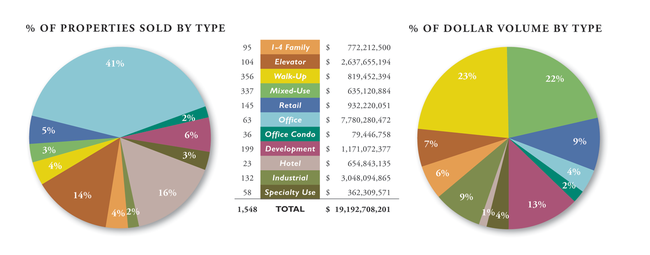
 Based on a Manhattan-based Massey Knakal Realty Services' Third Quarter 2011 Property Sales Report for the entire New York City area (Manhattan, Northern Manhattan/Bronx, Brooklyn, and Queens), during the first three quarters of 2011 (1-3Q11) there was $19.1B in NYC property sales, a 111% increase from 1-3Q10.
This represents an 80% increase over 2010 on an annualized basis. Thus far, there have been 1,548 properties sold, representing an annualized turnover of 1.25%.
The Brooklyn market has outpaced all markets with 529 property sales through 1-3Q11, or 34% of total properties sold. Manhattan leads all markets in terms of dollar volume with $16.7B of sales or 87% of the $19.1B sold citywide.
Massey Knakal report highlights include:
Manhattan (south of 96th Street on the east side and south of 110th Street on the west side)
- 414 transactions occurred in 1-3Q11, a 29% increase over 1-3Q10 and an increase of 27% over 2010 on an annualized basis
- 473 properties sold, an increase of 30% from 1-3Q10 and 29% from 2010 on an annualized basis
- The aggregate sales consideration was $16.7B, an increase of 135% over 1-3Q10, and an increase of 93% over 2010 on an annualized basis. The $5.7B from 3Q11, was the 2nd highest quarterly volume since 2Q08
Brooklyn
- 447 transactions occurred, a 22% increase over 1-3Q10 and an increase of 18% from 2010 on an annualized basis
- 529 properties sold, an increase of 25% from 1-3Q10 and an increase of 22% from 2010 on an annualized basis
- The aggregate sales consideration was $1BM, an increase of 27% over 1-3Q10, with a 33% increase on an annualized basis from the $1.053B in 2010
Queens
- 247 transactions occurred, an increase of 22% from 1-3Q10 and up 20% from 2010 on an annualized basis
- 269 properties sold, an increase of 20% from 1-3Q10, and up 19% on an annualized basis from 2010's properties sold
- The aggregate sales consideration was $695M, an increase of 106% over 1-3Q10, and a 70% increase on an annualized basis from 2010
Northern Manhattan (north of 96th St. east of Central Park and north of 110th St. west of Central Park)
- 68 transactions occurred, down 11% from 1-3Q10 and down 11% on an annualized basis from 2010
- 101 properties sold, down 7% from 1-3Q10
- The aggregate sales consideration was $262M, down 43% from 1-3Q10, and down 34% on an annualized basis from 2010
The Bronx
- 137 transactions occurred, an increase of 27% from 1-3Q10 and up 19% on an annualized basis from 2010
- 176 properties sold through 1-3Q11, an increase of 40% from 1-3Q10, and a 25% increase on an annualized basis from 2010
- The aggregate sales consideration was $423M, an increase of 31% from 1-3Q10, and an increase of 14% on an annualized basis from 2010
"Conditions in New York City's investment sales market continue to steadily improve. While the 3rd quarter dollar volume of $6.5 billion dipped below 2nd quarter figures, it was still the best quarter, with the exception of the 2nd quarter, since 2008," said Massey Knakal Chairman and Founding Partner Robert A. Knakal. "The number of properties sold increased to 548, the best quarterly total since 4th quarter 2008. We expect the number of properties sold to continue to increase as, notwithstanding recent activity, we still remain well below the long-term trend," added Knakal.


Sign Up Free | The WPJ Weekly Newsletter
Relevant real estate news.
Actionable market intelligence.
Right to your inbox every week.
Real Estate Listings Showcase
Related News Stories
Commercial Real Estate Headlines
- 2025 Prediction: U.S. Commercial Investment Recovery Expected to Gain Traction
- Holiday Retail Sales for 2024 to Hit Record $1 Trillion
- Tech, AI Industries Drive Largest Share of Office Leasing Activity in U.S.
- Commercial Real Estate Lending in U.S. Enjoys Strong Growth in Q3
- U.S. Multifamily Market Begins Recovery in Q3
- Commercial Investment in Japan Spikes 24 Percent Annually in Q3
- Despite Return-to-Office Mandates, U.S. Office Vacancies Continue to Rise
- PROPSIG Tech Startup Acquired by World Property Data
- U.S. Commercial Mortgage Debt Hits $4.7 Trillion in Q2 as Delinquencies Increase
- Hong Kong Class A Office Rents Continue to Downtick in Mid-Summer
- U.S. Office Landlords Tenant Concessions Decline for First Time in 4 Years
- U.S. Commercial Mortgage Originations Spike 27 Percent in Q2 Over Q1
- Phnom Penh's Commercial Office, Retail Markets Face Slowdowns in 2024
- Global Edge Data Center Market to Hit $300 Billion by 2026
- Commercial Property Transactions in Japan Dive 25 Percent Annually in Q2
- Delinquency Rates for U.S. Commercial Property Loans Downticks in Q2
- Megawarehouse Lease Deals in U.S. Increase in 2024
- Office Tenants' Flight to Quality Buildings Increases in 2024
- Commercial Lending in Japan Upticks 6 Percent Annually in Q1
- AI Driving Significant Global Data Center Growth in 2024
- Total U.S. Commercial Mortgage Debt Rises to $4.7 Trillion in Q1
- U.S. Commercial Mortgage Delinquencies Rise in Early 2024
- Asia Pacific Office Sector to Further Reprice Throughout 2024
- U.S. Retail Foot Traffic to Surpass Pre-Pandemic Levels by 2025
- Commercial Real Estate Lending in U.S. Slowed in First Quarter
- Japan Commercial Property Investment Volume Jumps 7 Percent in Q1
- Asia Pacific Commercial Property Investment Leads the World, Spikes 13 Percent
- Driven by High Rates, U.S. Commercial Lending Imploded 47 Percent in 2023
- After Two Year Slump, Prime Multifamily Metrics Uptick in U.S.
- Commercial Co-Broker Commissions Not Affected by NAR-DOJ Settlement, Yet
- U.S. Office Buildings with Upscale Tenant Amenities Still Enjoy Premium Rents in 2024
- U.S. Commercial, Multifamily Mortgage Delinquency Rates Uptick in Q4
- U.S. Commercial Mortgage Debt Continued to Rise in 2023, Hits $4.7 Trillion
- Nonresidential Construction Spending in the U.S. Falls Sharply in January
- U.S. Multifamily Construction Starts to Decline in 2024
- Commercial Mortgage Lending in U.S. Shows Signs of Stabilization in Late 2023
- Architecture Billings Decline in December as Soft Business Conditions Persist
- Government Sector Claimed Largest Portion of 100 Biggest U.S. Office Leases Signed in 2023
- U.S. Commercial, Multifamily Borrowing Dives 25 Percent Annually in Late 2023
- Record High Multifamily Construction Deliveries Drive Vacancy Rates Higher
Reader Poll
Marketplace Links
This website uses cookies to improve user experience. By using our website you consent in accordance with our Cookie Policy. Read More


